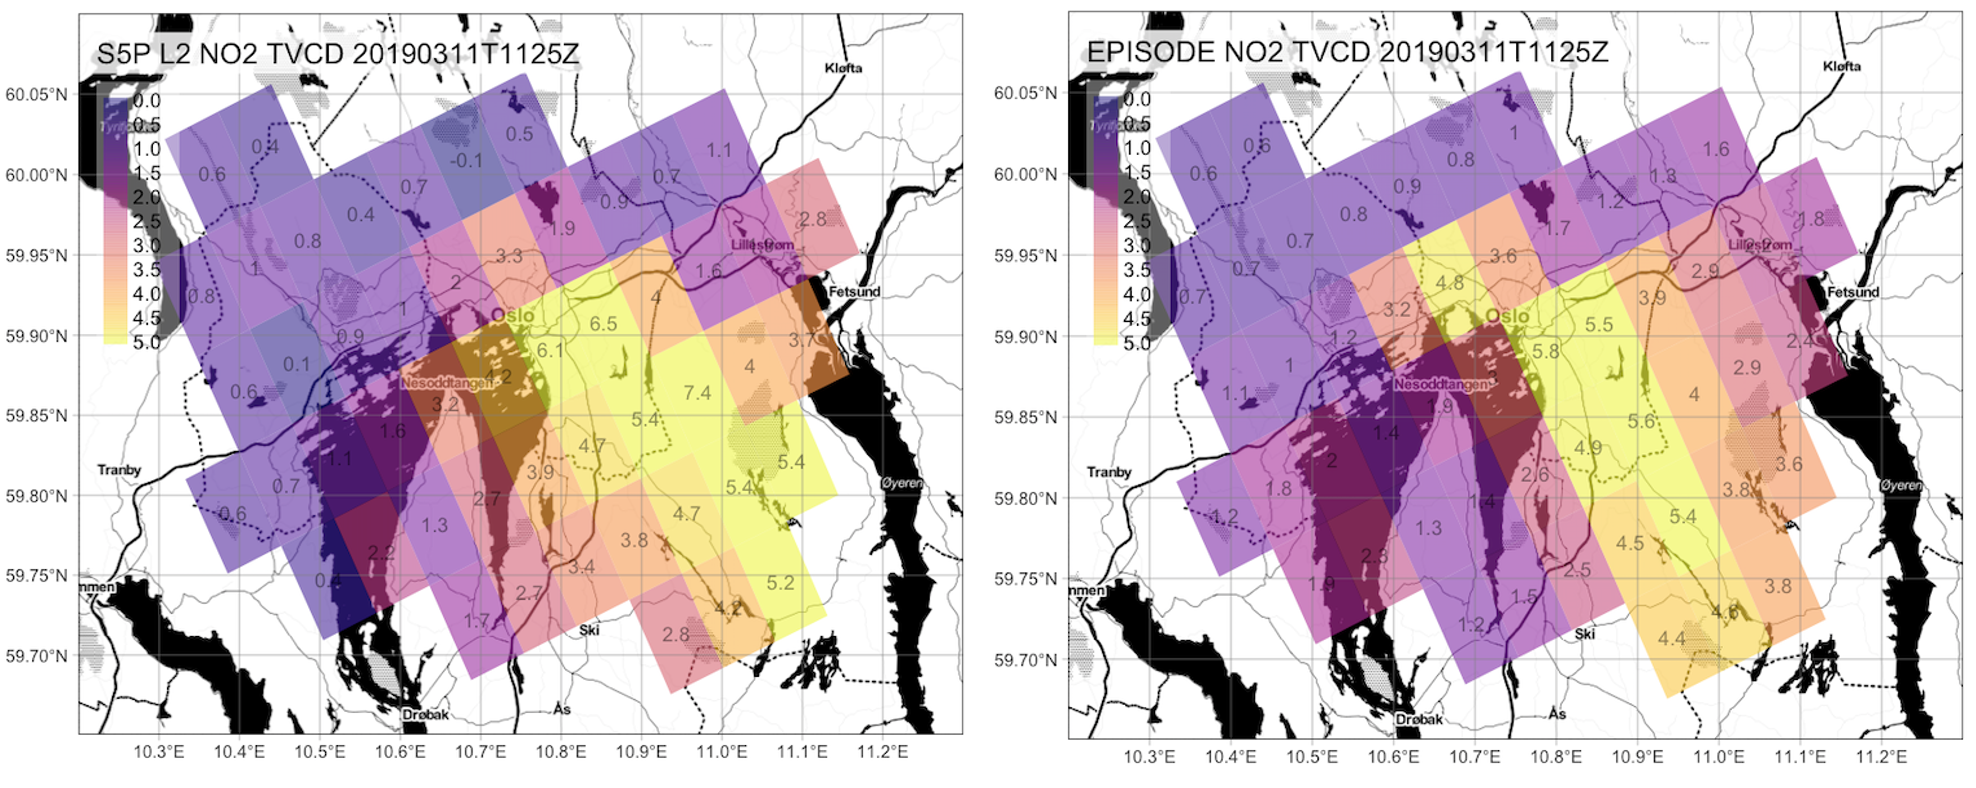
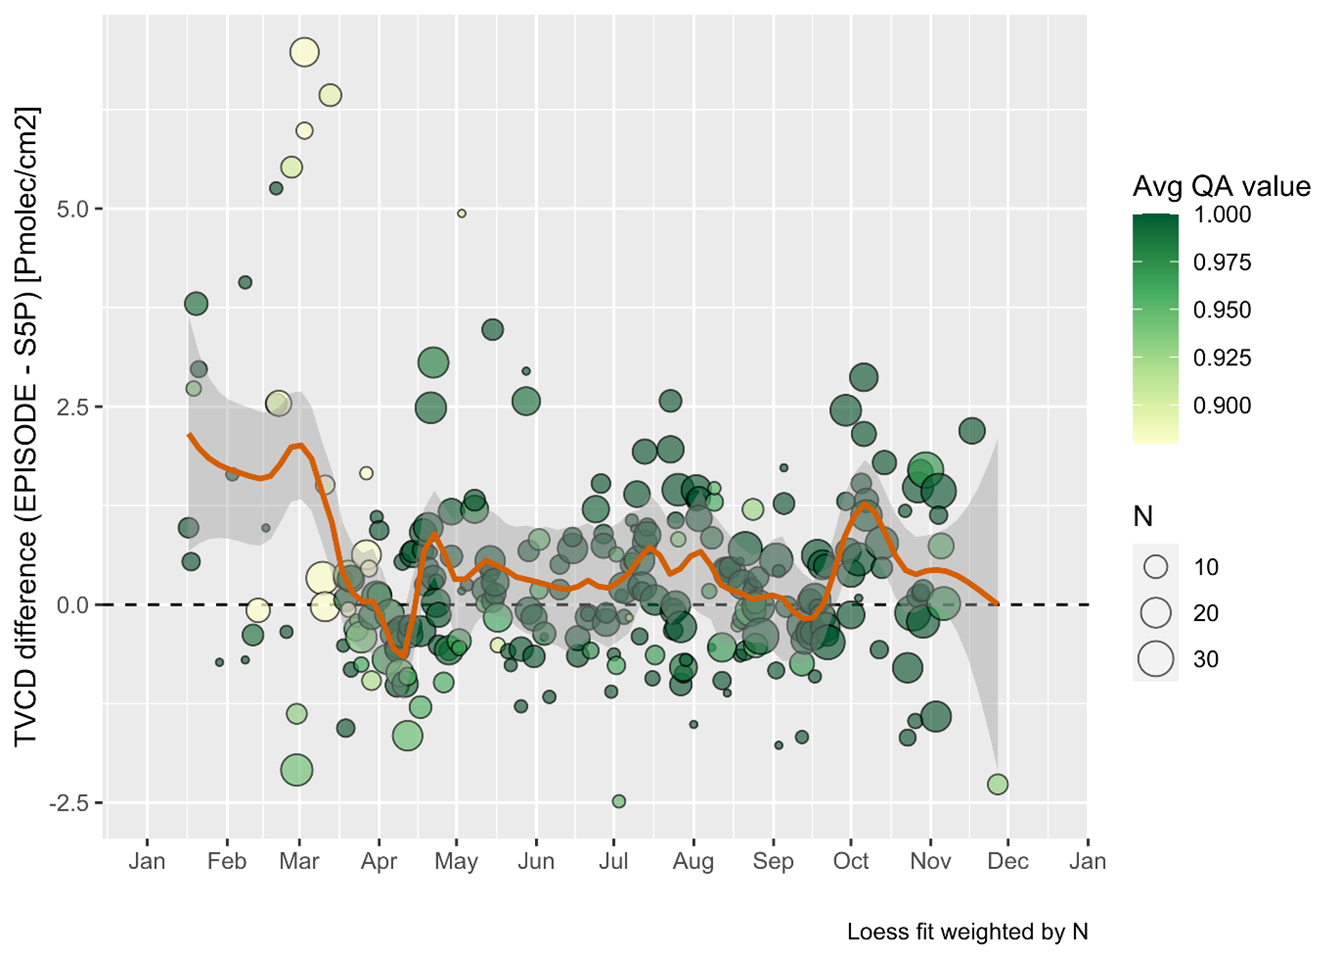
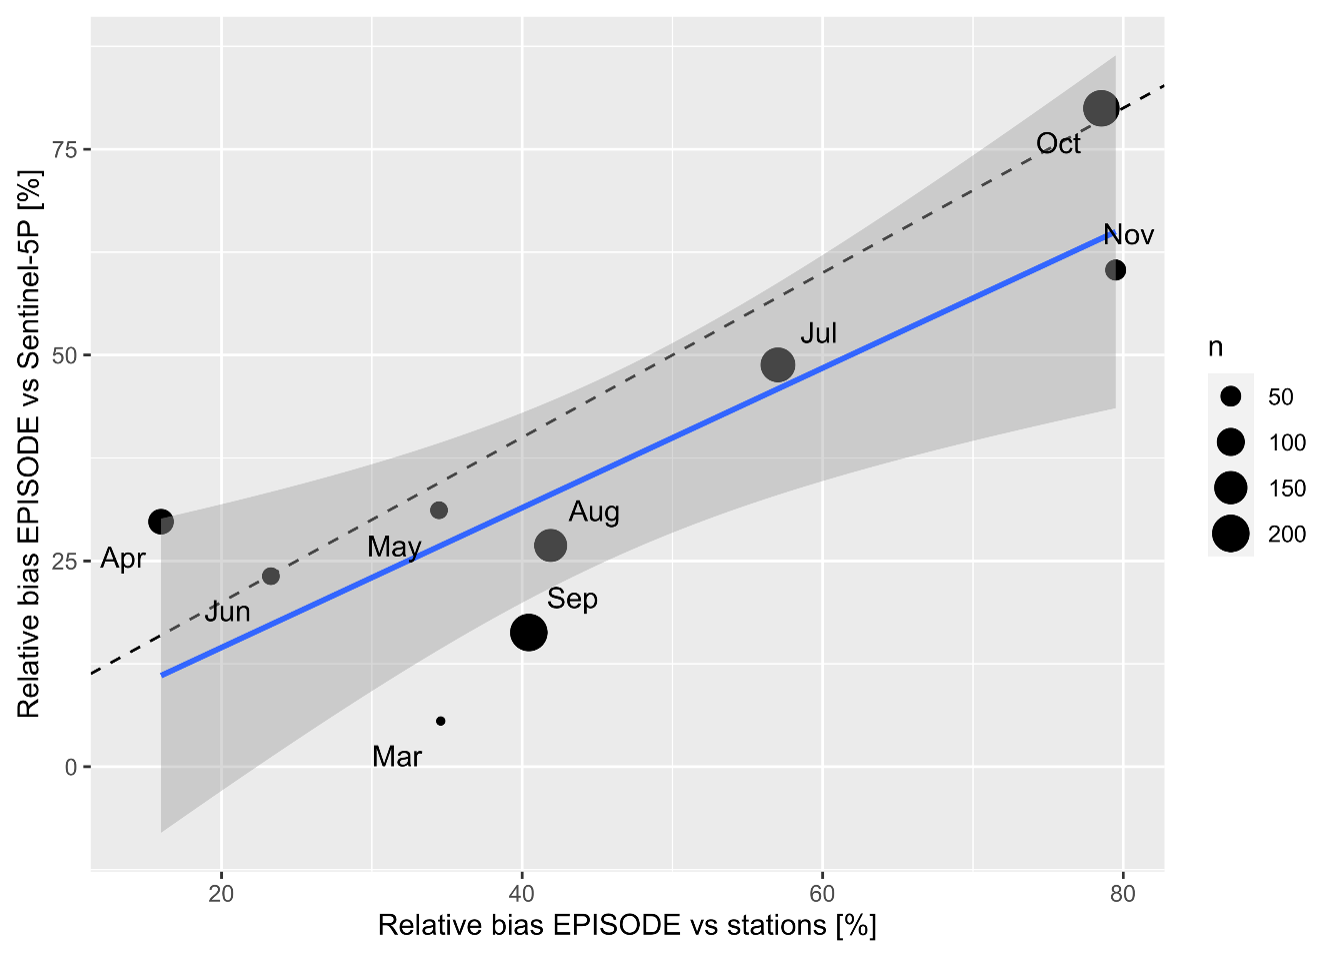
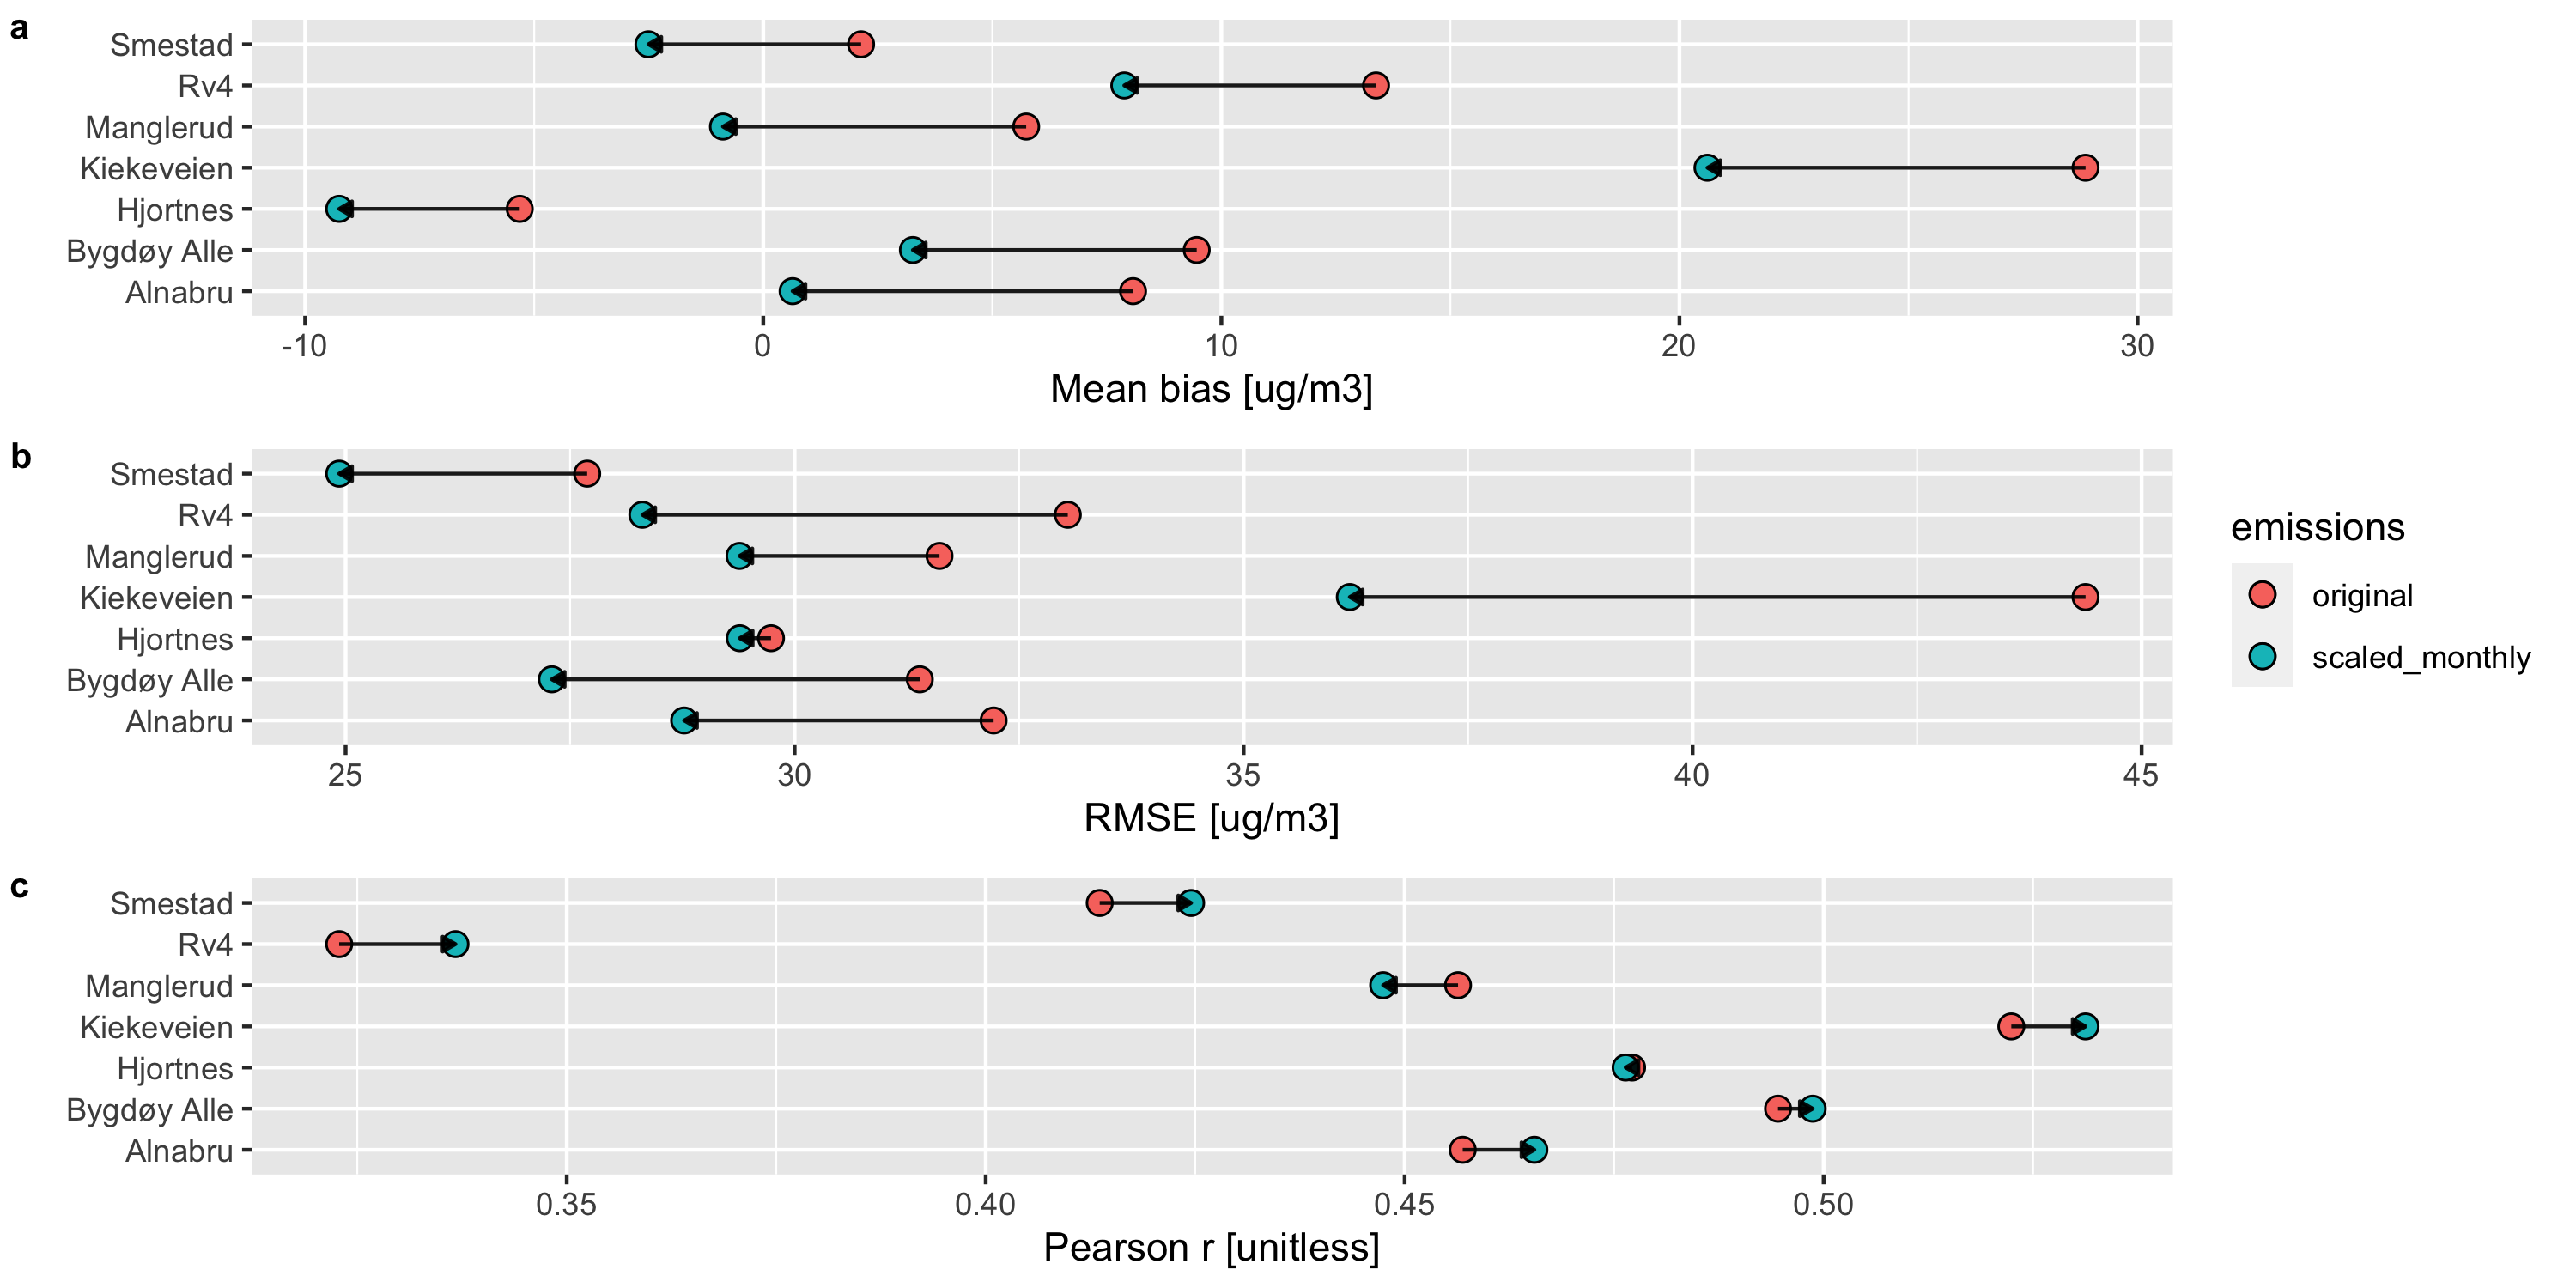
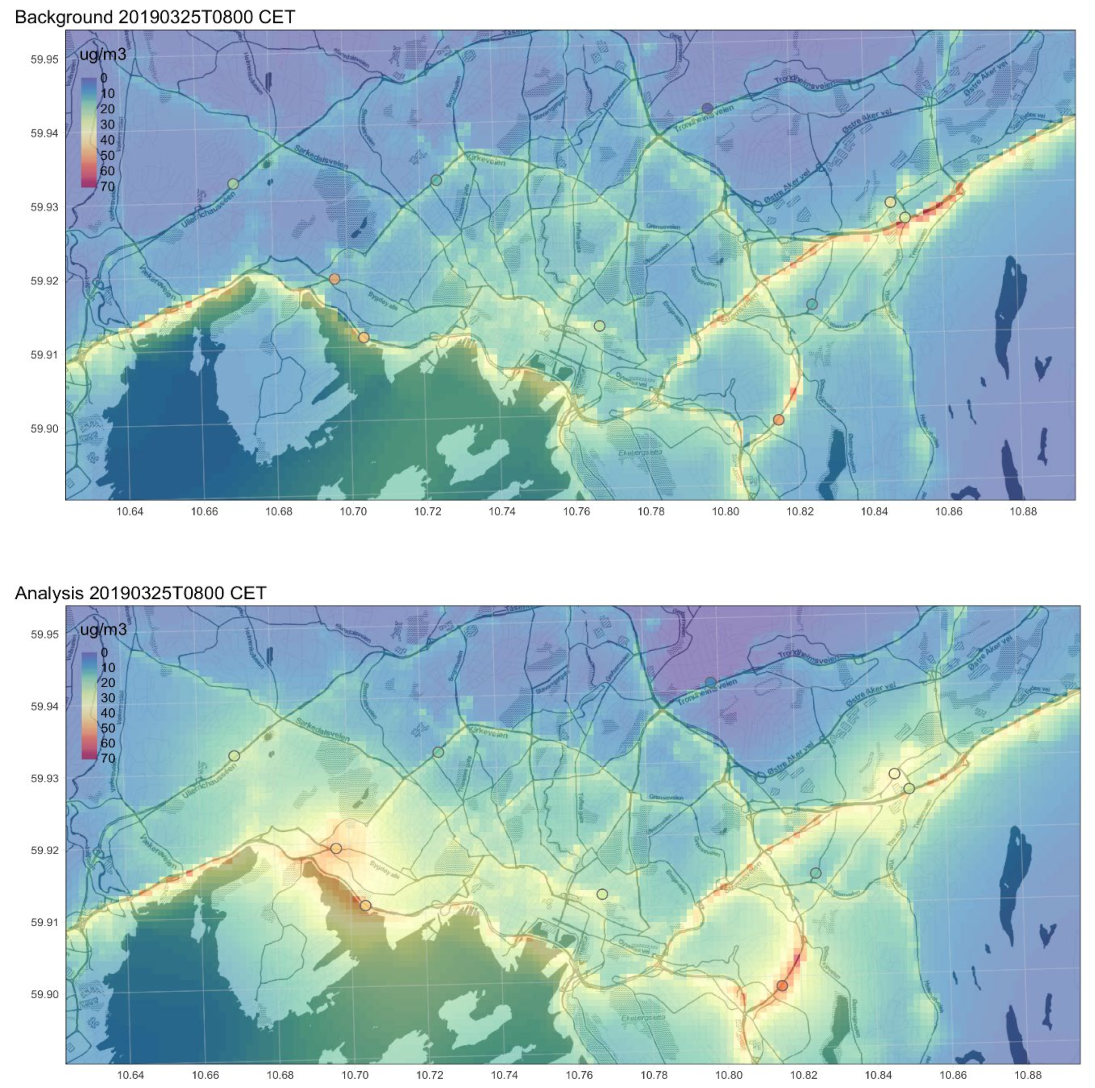
The Oslo case study exploits the information provided by the TROPOMI instrument on Sentinel-5P (Schneider et al., 2021) among other things to improve the EPISODE urban-scale dispersion model (Hamer et al., 2020). To do so we first built an observation operator than can translate the model output into observation space, i.e. makes it comparable to the TROPOMI column observations (Figure 1). This capability is then used to calculate the biases between TROPOMI NO2 columns and modeled NO2 columns throughout the year (Figure 2). The result indicate that the biases between satellite and model correspond very well to the biases between model and measurements at air quality monitoring stations (Figure 3). As such, the satellite-derived model biases can be used to modify the underlying emissions and the model can subsequently be re-run using updated emissions. Comparing the updated model output to reference measurements indicates that the inclusion of S5P/TROPOMI-corrected emissions results in up to 20% higher accuracy of the model throughout the year (Figure 4). This “calibrated” model can subsequently be used for integrating surface observations from monitoring stations and low-cost sensor systems using data assimilation techniques (Figure 5) (Lahoz et al., 2014; Schneider et al., 2017; Mijling, 2020).
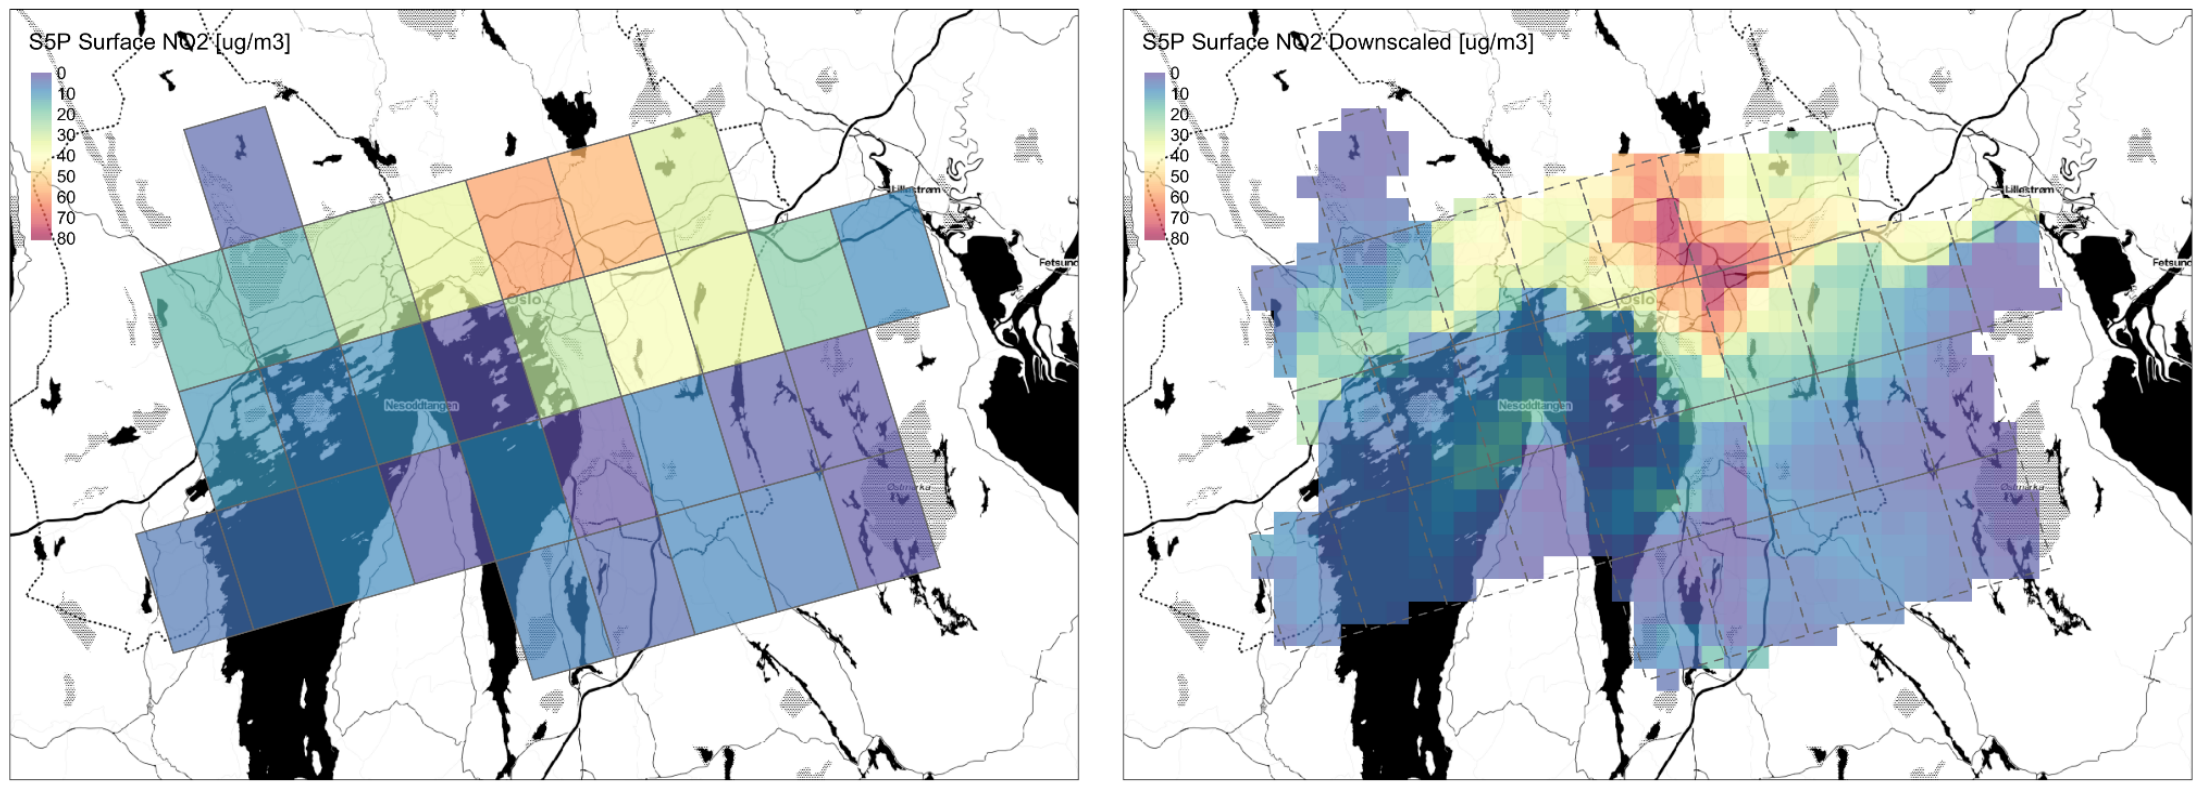
In addition, geostatistical downscaling (Stebel et al., 2021) has been used increase the spatial resolution of surface NO2 fields derived from S5/TROPOMI data, in order to make the product more useful for urban-scale monitoring (Figure 6).
References
Hamer, P. D., Walker, S.-E., Sousa-Santos, G., Vogt, M., Vo-Thanh, D., Lopez-Aparicio, S., Schneider, P., Ramacher, M. O. P., and Karl, M.: The urban dispersion model EPISODE v10.0 – Part 1: An Eulerian and sub-grid-scale air quality model and its application in Nordic winter conditions, Geosci. Model Dev., 13, 4323–4353, https://doi.org/10.5194/gmd-13-4323-2020, 2020. https://doi.org/10.5194/gmd-13-4323-2020
Lahoz, W. A., & Schneider, P. (2014). Data assimilation: Making sense of Earth Observation. Frontiers in Environmental Science, 2, 16. https://doi.org/10.3389/fenvs.2014.00016
Mijling, B. (2020). High-resolution mapping of urban air quality with heterogeneous observations: A new methodology and its application to Amsterdam. Atmospheric Measurement Techniques, 13(8), 4601–4617. https://doi.org/10.5194/amt-13-4601-2020
Schneider, P., Castell, N., Vogt, M., Dauge, F. R., Lahoz, W. A., & Bartonova, A. (2017). Mapping urban air quality in near real-time using observations from low-cost sensors and model information. Environment International, 106, 234–247. https://doi.org/10.1016/j.envint.2017.05.005
Schneider, P., Hamer, P. D., Kylling, A., Shetty, S., & Stebel, K. (2021). Spatiotemporal Patterns in Data Availability of the Sentinel-5P NO2 Product over Urban Areas in Norway. Remote Sensing, 13(11), 2095. https://doi.org/10.3390/rs13112095
Stebel, K., Stachlewska, I. S., Nemuc, A., Horálek, J., Schneider, P., Ajtai, N., Diamandi, A., Benešová, N., Boldeanu, M., Botezan, C., Marková, J., Dumitrache, R., Iriza-Burcă, A., Juras, R., Nicolae, D., Nicolae, V., Novotný, P., Ștefănie, H., Vaněk, L., … Zehner, C. (2021). SAMIRA-SAtellite Based Monitoring Initiative for Regional Air Quality. Remote Sensing, 13(11), 2219. https://doi.org/10.3390/rs13112219